


Chart.js is an easy, object orientated HTML5 charting library for designers and developers. Chart.js makes data visualisation very easy, allowing you to display data graphically in your web projects – and all it takes is just a few minutes to set up.
Step 1: Add the JS libraries
Chart.js doesn’t just work out of the box. You have to set it up. At first, you need to include two JavaScript libraries in the footer of your web page. These libraries are jQuery, something you might be familiar with, and Chart.js, the code that renders the charts (the real deal). Here’s how you should do it.
<script src="http://ajax.googleapis.com/ajax/libs/jquery/1.9.1/jquery.min.js"></script>
 <script src="Chart.min.js"></script>
Step 2: Place the JS code for your chart
To render your data visually on a chart, you have to first decide the chart type. The chart types available are Doughnut, Line, Pie, Radar, Bar and Polar Area. These are the six various chart types that you can use in Chart.js, but the ones you will use the most are probably going to be bar, line and pie chart types.

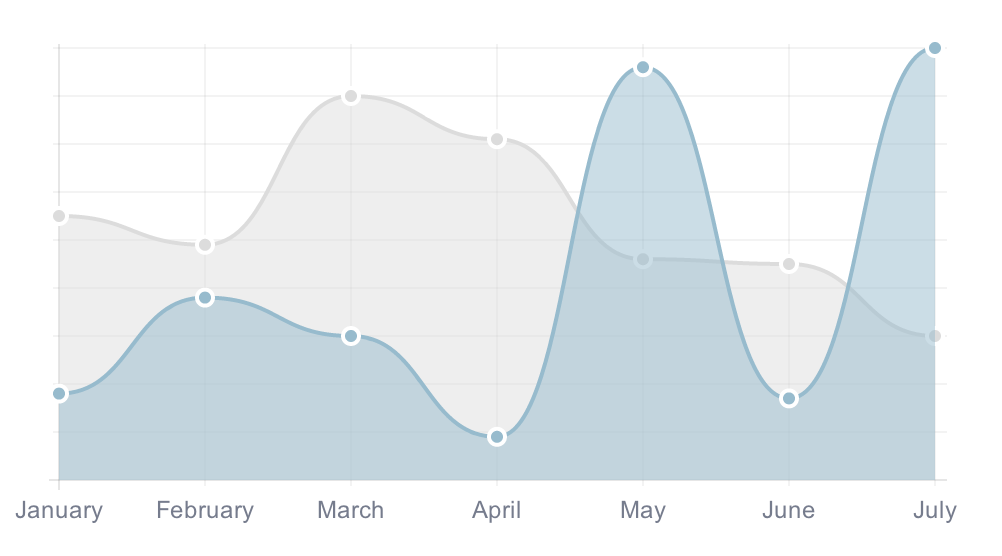
Here’s how you can initialise a line chart.
var lineChartData = {
 labels : ["","","","","","",""],
 datasets : [
 {
 fillColor : "rgba(220,220,220,0.5)",
 strokeColor : "rgba(220,220,220,1)",
 pointColor : "rgba(220,220,220,1)",
 pointStrokeColor : "#fff",
 data : [65,59,90,81,56,55,40]
 },
 {
 fillColor : "rgba(151,187,205,0.5)",
 strokeColor : "rgba(151,187,205,1)",
 pointColor : "rgba(151,187,205,1)",
 pointStrokeColor : "#fff",
 data : [28,48,40,19,96,27,100]
 }
 ]

 };
As you can see the code above, adding labels, data points or changing colors of various chart properties is extremely easy. Once the chart type variables are set, you have to create a new Javascript Chart object to make it work. You can do this by adding the following line of code just below code shown before. Remember to keep your Javascript code in the footer so your site loads quicker.
new Chart(document.getElementById("line").getContext("2d")).Line(lineChartData);
Step 3: Adding the Canvas Element
The Javascript code has done 90% of the work, so what’s the remaining 10%? Well, you have to use HTML5′s canvas element to render the chart somewhere. This is easily done with just a single line of code as shown below.
<canvas id="line" height="300" width="200"></canvas>
Step 4: There is no step 4.
There is no step 4 really. You’re done. The Chart.js is build to make your life easier, and all it takes is just 3 simple steps to create, initialise and render your HTML5 chart for your website/web application.
Conclusion
Don’t forget to review the source code in the Live Demo (link given on the top of the tutorial) to see how you can render multiple charts on a single page. The source code is provided in a .zip file for you to play around on your own computer. If you have any problems setting Chart.js for your web project, do not hesitate to pop a comment below. Till then, adios.
About Ali Gajani
Hi. I am Ali Gajani. I started Mr. Geek in early 2012 as a result of my growing enthusiasm and passion for technology. I love sharing my knowledge and helping out the community by creating useful, engaging and compelling content. If you want to write for Mr. Geek, just PM me on my Facebook profile.


Pingback: Can't graphic with Chart.js and JQuery Mobile - HTML5 Solutions - Developers Q & A()